Bicycle Import Volumes Heading for Financial Year Record Low
Canberra, ACT
The number of bicycles being imported to Australia is remaining at very low levels, as the “covid stock overhang” continues.
When we last wrote about bicycle imports here, January and February 2024 data was showing signs of a rebound after 18 months of low imports.
But now that we have data for March, April and May 2024 that potential rebound turned out to be more like a mirage.
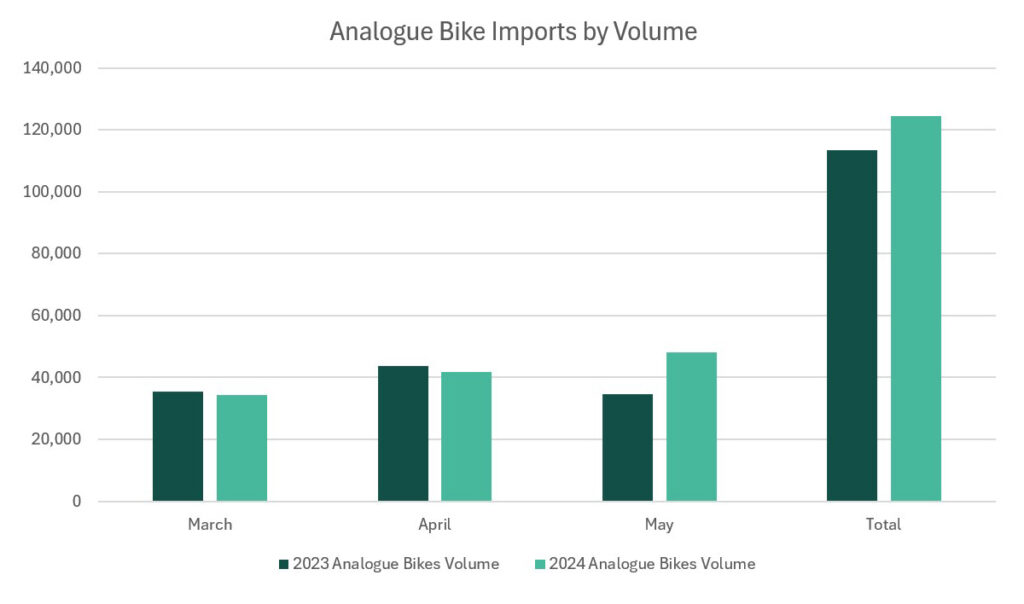
In total 124,347 bicycles were imported for those three months. That is up 9.5% on the 113,463 bicycles for the corresponding three months in 2023, but the charts below show how anaemic import levels still are compared to pre-covid years.
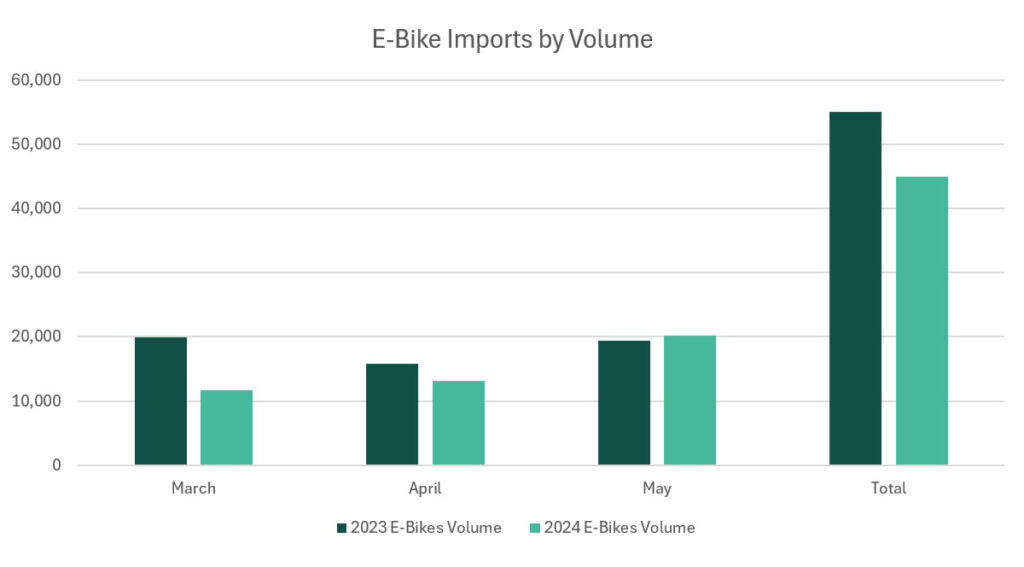
E-bike Imports also dropped for the months of March to May 2024 compared to the corresponding three months in 2023. In total 44,972 e-bikes were imported from March to May 2024 compared to 55,119 for those months in 2023. That’s a drop of 18.5%.
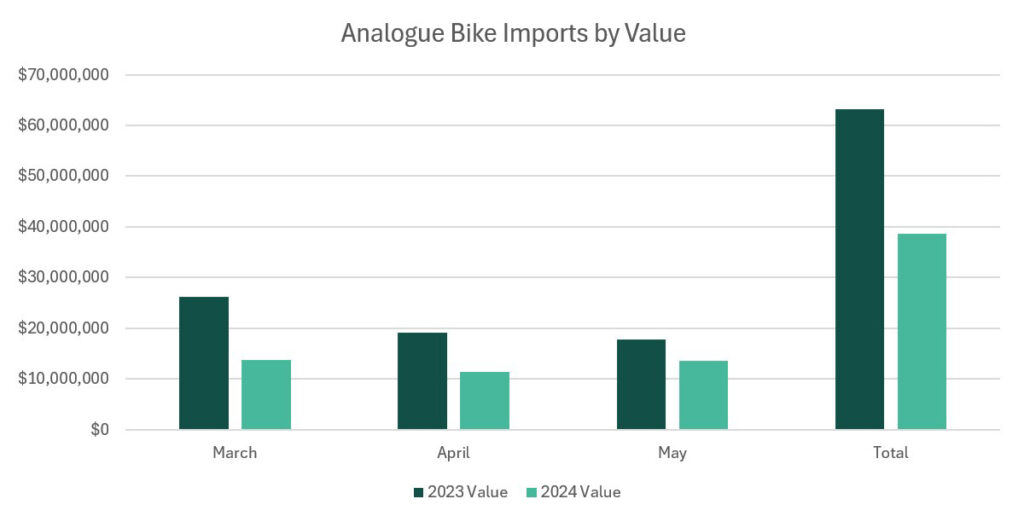
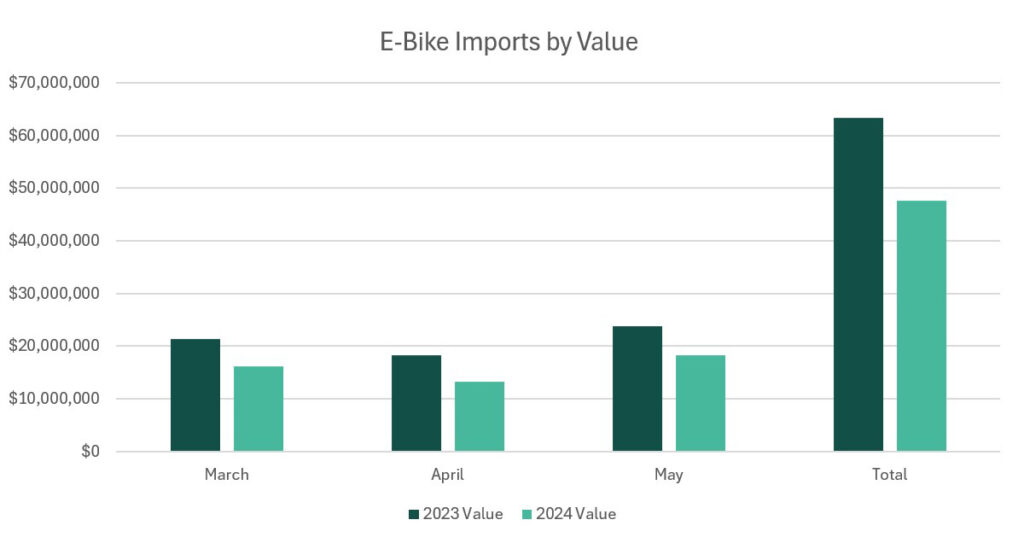
The value of both analogue bikes and e-bikes imported for these months also dropped, both in terms of the total value and the unit value per bike.
Looking at the break down of children’s bikes imported vs adult bikes, 50,872 children’s bikes were imported for these three months in 2024 compared to 43,489 last year, an increase of 16.9%. Meanwhile 73,475 analogue adult bikes were imported for these three months this year compared to 69,974 for the same period last year an increase of 5%. This was offset by a drop in e-bike imports, which are not split into adults and children’s e-bikes, but it’s safe to assume that the vast majority of e-bikes are for adults (even though we’re starting to see a few kid’s e-bikes enter the market).
We’re now up to 23 months of published data since bicycle imports started their significant decline in June 2022.
Projected 2023-24 Financial Year Totals Down
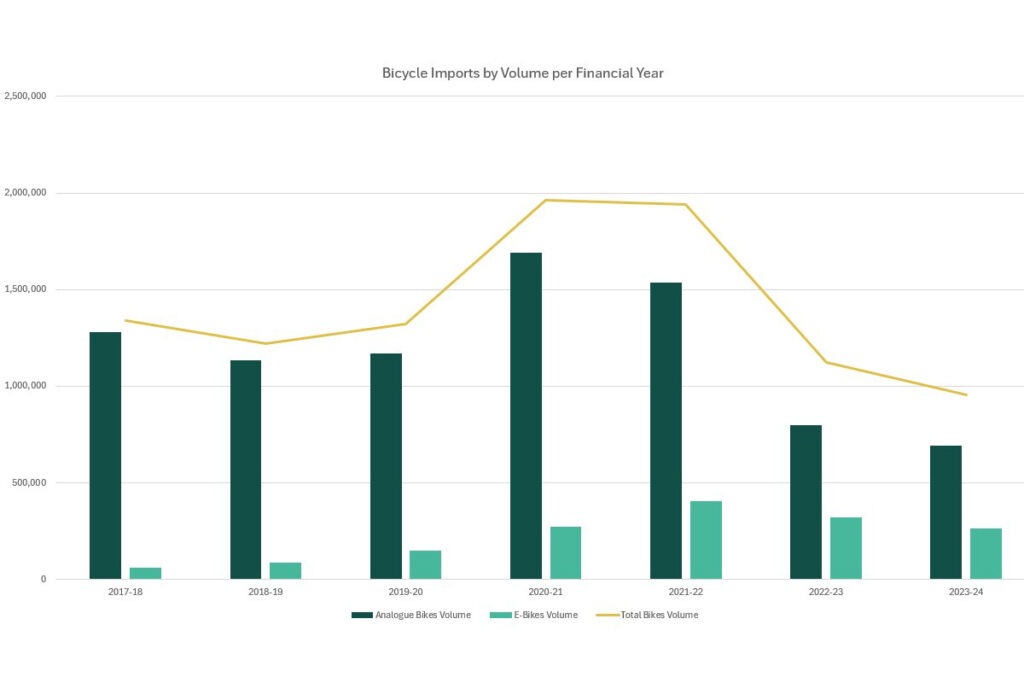
Now that we have figures for the first 11 months of the 2023/24 financial years, it’s getting safer to predict that it will be a record low financial year in terms of total Australian bicycle imports. In fact, the only other year that comes close was 2022/23.
If June 2024 imports match May 2024 actual data, then we’ll end the financial year with a total of 692,084 analogue bikes imported. That’s 108,013 less than the previous financial year’s total of 800,097, a drop of 13.5%.
2022/23 was the first post covid stock overhang full financial year, so imports were below average then. To get the total import numbers we need to add e-bike imports, giving us a total volume of 1,121,796 units in 2022/23 and 953,609 units in 2023/24, a drop of 15%.
When you compare this projected 2023/24 total to the pre-covid average of all financial years from 2009/10 to 2018/19, which was 1,264,524 bicycles per year, you get a truer picture of just how low the import volumes are now. But the lower volume is offset by the higher unit value of e-bikes.
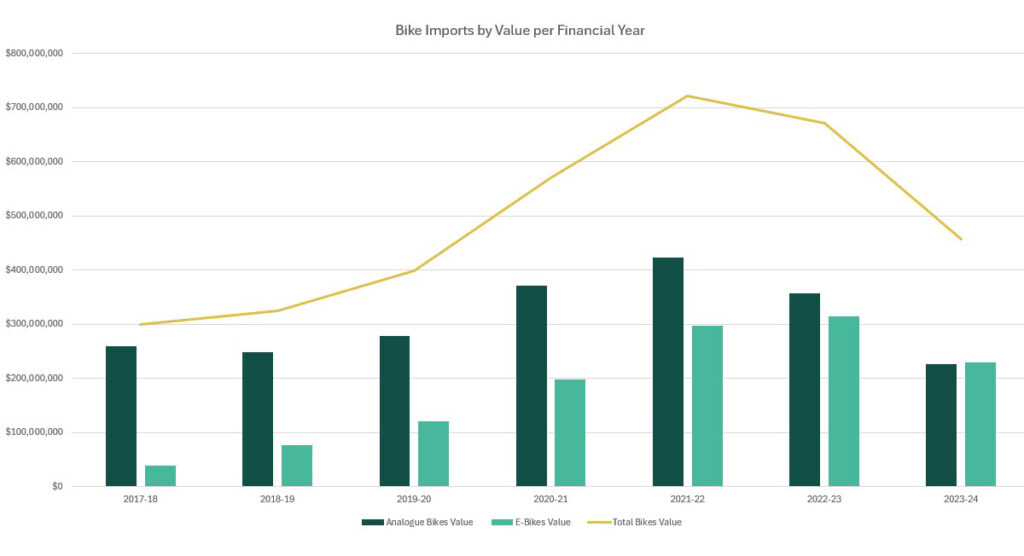
One interesting milestone that looks set to be passed in the 2023/24 financial year is that the total value of e-bikes imported will slightly exceed the total value of analogue bikes imported.
Retail sales total value of e-bikes are probably still slightly lower than analogue bikes, due to the higher average margins on analogue bikes. Australia doesn’t collect or publish retail sales data, so we can’t be sure, but the two categories would be very close.
Assumptions Made
These figures are based upon several assumptions, two of which we’ve mentioned previously, but worth repeating.
Regarding import numbers of analogue bicycles, we only use 70% of the children’s bike category, considering that the other 30% would be better described as wheeled toys. This percentage has been consistently applied since we started reporting on import data in the 1990’s.
Meanwhile regarding e-bikes, where it shares the same customs code with e-motorcycles and e-mopeds, each month we assume that 90% of the imports are e-bikes and 10% for the other categories.
Whatever percentage we select will almost certainly be wrong, but because we’ve consistently applied this percentage across every year since e-bike import data became available, at least these imperfect figures can be compared from one year to the next.
Until the Australian bicycle industry finally cooperates on collecting more accurate and timely data, ideally from point of sale at retail level, then we’ll continue to have to make educated guesses like this from the limited import data that is all we currently have available.
The situation seems to be worsening if anything, I’d love to see a 2025 update.