Bicycle Imports Showing First Signs of Normalising

Canberra, ACT
After 18 months of dramatically lower monthly bicycle imports, the latest figures are showing early signs that import numbers might be beginning to return to more normal pre-covid levels.
Since we last wrote about bicycle imports here we have received import data for January and February 2024.
In January a total of 51,765 bicycles were imported, broken down into 20,260 kids bikes and 31,505 adult bikes. This is just 2,953 units or 5.3% lower than the January 2023 figure of 54,718.
In February a total of 49,583 bicycles were imported, comprising 19,864 kids bikes and 29,720 adult bikes. This is 17,173 units, up upon 2023 which is a 52% increase year on year.
It’s even up slightly on the pre-covid February 2020 figure of 45,232.
Meanwhile E-Bike Imports were also trending upwards. In January 2024 29,069 ebikes were imported, an increase of 6,287 units or 27.5% percent over the January 2023 total of 22,782.
In February 2024 20,494 e-bikes were imported, up 2,480 units or 13.7% on Feb 2023’s total of 18,014.
As we have explained in more detail here, in all cases, when it comes to e-bike data, we are taking 90% of the import code figure as e-motorcycles are also included within the same code. Therefore, every e-bike import figure includes an element of estimation.
The same applies to children’s analogue bike imports where we take 70% of the import code figure, because we consider the remaining 30% to be better described as wheeled toys.
In both cases, as long as these percentages are applied consistently across every year’s data, at least we’re comparing “apples with apples” when looking at trends.
Our Changing Market Explained in Five Charts
It’s often hard to comprehend data when it’s just conveyed as numbers written within an article, which is why I like to create charts.
I hope that following five charts will give you a better feel for what’s happening in our industry.
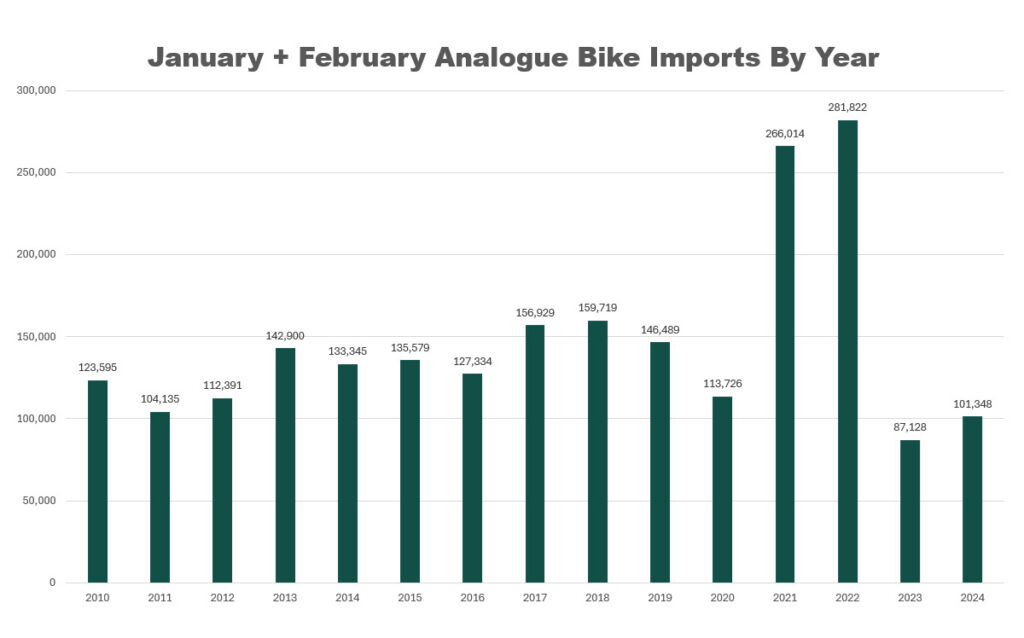
From this chart you can see why I added the words “First Signs of Normalising” within the headline of this article and am not claiming that the market has yet returned to normal.
When you add the first two months of analogue bike import figures for 2024, they’re up by 16% on 2023, but it’s still the second slowest start to the year since 2010. We’re not even back to pre-covid levels yet.
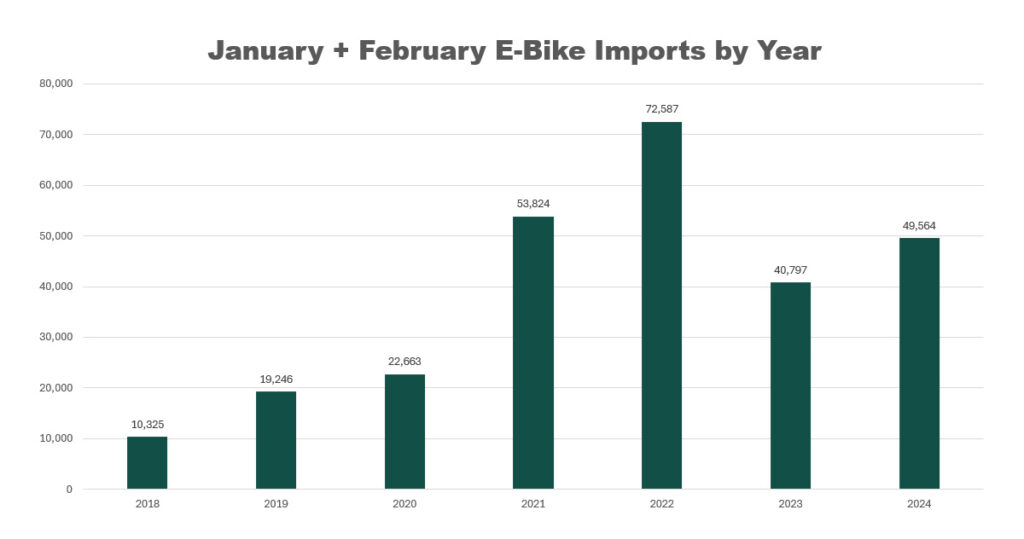
It’s a different story when you look at e-bike imports for the combined months of January and February.
Our available data only goes back to 2018 when this market sector was embryonic. But you can see that January/February 2024 was the third biggest start to the year on record, and only 8.5% lower than the first of the two covid boom years.
That’s because e-bikes are still on a rapid growth trajectory, that we’ll talk more about through the following charts…
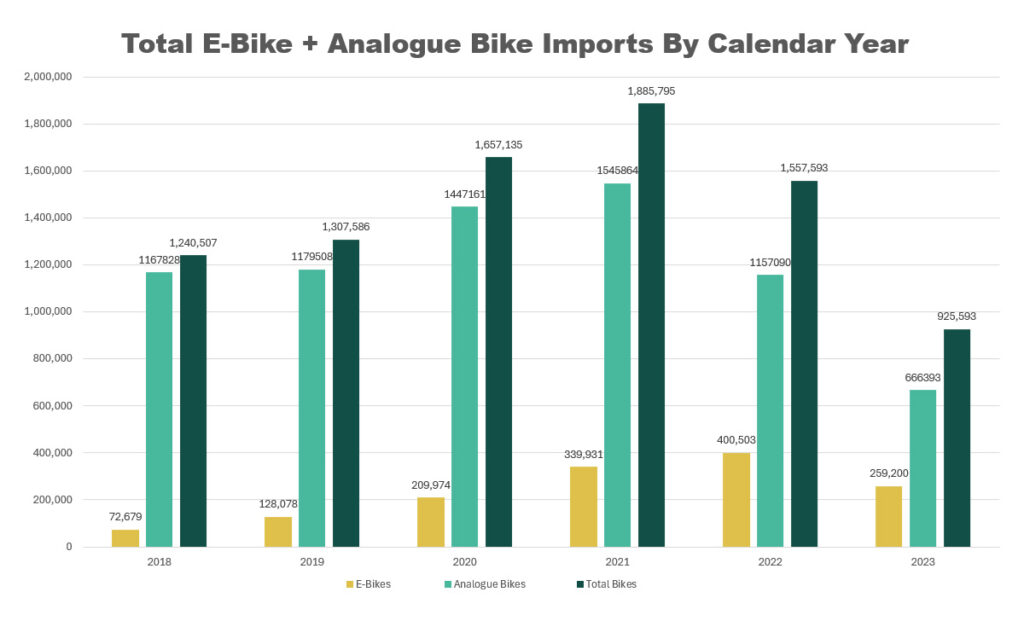
This chart is showing e-bike imports by full calendar year in yellow, then analogue bike imports in light green and the total of those two columns in dark green.
You can see that as a proportion of total imports, e-bikes are growing larger each year. You can also see that analogue bike imports have more than halved from their peak of 1,545,864 units in 2021, down to just 666,393 units in 2023. That’s a drop of 879,471 units.
But e-bike imports only dropped by 141,303 units from their peak in 2022 of 400,503 units, to 259,200 units in 2023. That’s a far lower drop in absolute terms and also lower in percentage terms.
If Australia follows the trend of Germany and other international markets, then analogue bike sales will never return to their pre-covid levels. E-bikes will fill the gap instead.
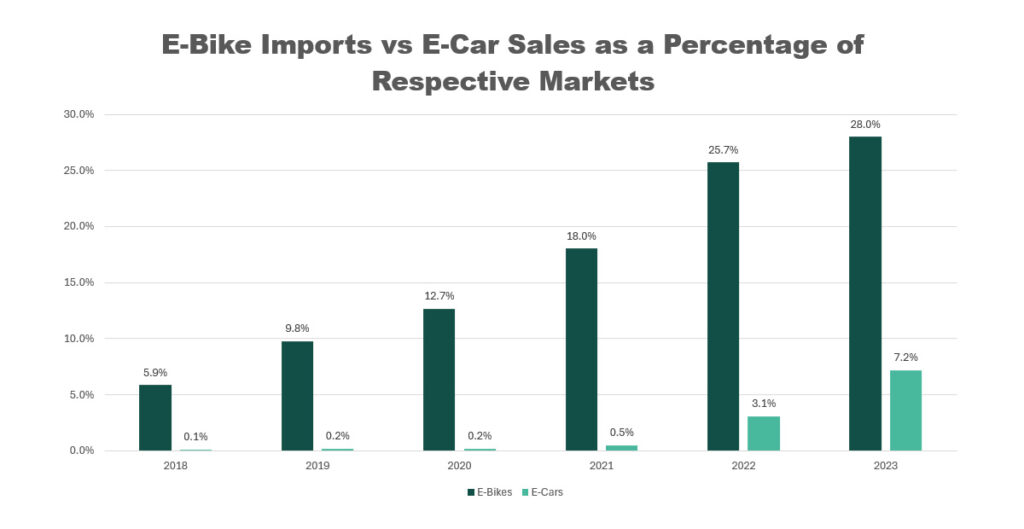
This chart shows that e-bike imports now comprised 28% of all bicycle imports in calendar year 2023. If you refer to the article we’ve just published in The Latz Report entitled “Latest Bicycle Sales Data from Key Cycling Nations Shows Further e-Bike Growth” you will see how far the Australian e-bike market share lags behind market leaders.
“…it’s not taking a huge risk to predict that the market share of e-bikes over analogue bikes will continue to grow in Australia.”
In Germany e-bikes now account for 53% of the market by volume. In the Netherlands it’s 56% by volume and 80% by value. In other words, $4 out of every $5 in retail bicycle sales there are accounted for by e-bikes.
Clearly those markets are different to Australia’s but it’s not taking a huge risk to predict that the market share of e-bikes over analogue bikes will continue to grow in Australia. That’s in part why we’ve adopted the terminology “Analogue” bikes rather than “Normal” or “Traditional” or “Regular”. Once the e-bike market share exceeds 50%, as it’s already doing in Australia when measured by value, then what is a “Normal” bike and what is not?
You’ll notice that in this chart we’ve also included sales of electric cars within Australia. You can see that e-bikes have a far larger share of the total bike market than electric vehicles (EV’s) have of the car market. But the EV’s are currently growing at a faster rate in percentage terms.
Perhaps that’s in part because state and federal governments and subsidising EV purchases through a wide range of different incentives. Meanwhile they’re doing nothing for e-bikes and in fact still imposing 5% import tariffs on many of them.
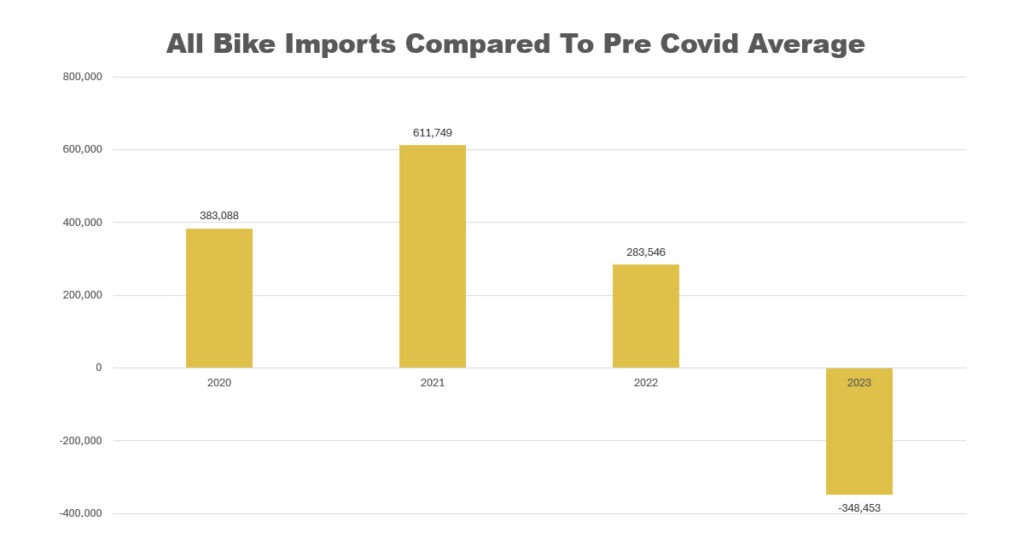
This final chart is the simplest in terms of amount of data contained, but probably requires the most explanation.
I’ve taken the average of 2018 and 2019 combined e-bike and analogue imports to be the baseline. That figure was 1,274,046 units. In other words, before covid began, we were ticking along in a fairly stable market (actually it was slightly declining) at about one and a quarter million units. That figure is the baseline of zero in this chart.
Then in 2020, the first year of covid, we imported an “extra” 383,088 bicycles. In “peak covid lockdown mode” during 2021 we imported 611,749 extra bikes above our pre covid baseline.
In 2022 covid lockdowns were finishing, international travel was back on everyone’s agenda and the bike boom was over, but we couldn’t turn off the import taps fast enough. We still imported an extra 283,546 bicycles above our pre-covid average. These were the bikes that probably did the most damage in terms of the discounting that followed.
In 2023, faced with a big stock overhang and growing discounting, we imported 348,453 fewer bikes than the pre-covid average.
As we’ve said earlier in this article, based upon Jan and Feb 2024 data, early signs are that we might be moving closer to pre-covid average imports for 2024. It’s too soon to say for sure, but let’s say 2024 finishes exactly at the pre-covid baseline, then over the entire covid boom and bust we will have finished up importing in total 929,930 more bikes than the pre-covid baseline.
That’s broken down as 1,278,383 “extra” bikes in 2020, 2021 and 2022 followed by a 348,453 correction in 2023.
It could well be that 2024 still ends up down on the pre-covid baseline. The crucial data that we’re missing that would make this much easier to predict is sales data. Despite decades of talk, we still don’t collect retail or wholesale sales data in our industry, which costs everybody lost profits in terms of being forced to make guesstimates when it comes to critical buying decisions, which as we can see from this data, are not always correct.
Thanks to Bicycle Industries Australia who compile and share Australian Border Force import data.