E-Bike Import Value Is Approaching Conventional Bikes Value

Canberra, ACT
As all Australian bicycle industry members know, for more than a year now we’ve been in a situation of overstock, leading to discounting that is eroding profit margins for both wholesalers and retailers.
Therefore, while it would normally be a concern to see import levels falling, right now it’s good news. We recently received a further three months of data since we last reported on import figures here.
In summary, conventional bike import units have fallen dramatically, but their unit value is up significantly, which lessens the fall in total dollar value terms. Meanwhile e-bike import total values have continued to rise.
Before showing charts and talking about specific comparisons, there are a couple of very important caveats to make about the import data which is sourced from the Australian government’s Border Force, previously known as Australian Customs.
“…while it would normally be a concern to see import levels falling, right now it’s good news.”
Firstly when it comes to conventional bikes, which is broken down into separate codes Adult Bikes and Children’s Bikes, for the past 25 plus years since we began reporting on import data, we’ve always only included 70% of the children’s bike total, on the assumption that the other 30% would be better described as ‘wheeled toys’. Because we’ve done this consistently, you can safely compare ‘apples with apples’ when looking at data over previous years.
When it comes to e-bikes, as we reported in our previous article here, the relevant tariff code 8711.60.00 is defined as, “Motorcycles (including mopeds), bicycles and other cycles fitted with electric motor for propulsion, with or without sidecars.”
In that previous article I estimated that 80% of this code was comprised of e-bikes and 20% of all other items described in that code. Upon further conversations and visits to importers and retailers of electric motorcycles and mopeds, it appears that, so far at least, that market is very small indeed, so for this article I’m revising my estimate to 90% e-bikes and 10% e-motorcycles and e-mopeds. Clearly it would be much better if there was a unique code solely for e-bikes, but until that happens or until we start seeing electric motorcycles and mopeds on our streets, I’m going to stick with this 90%/10% estimate for this and future articles.
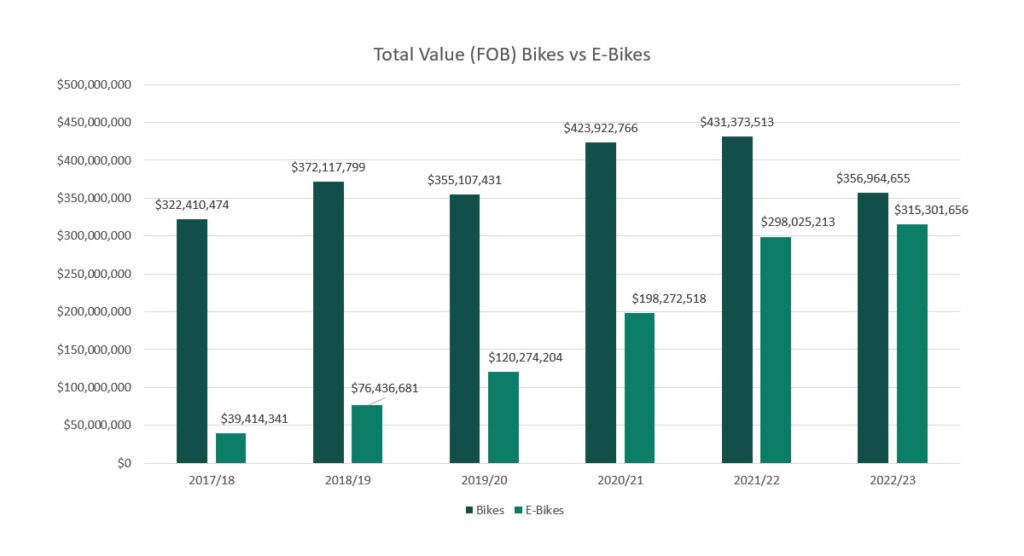
As you can see from one of the comparison charts below, just six years ago the total value of conventional bike imports was 8.2 times greater than the value of e-bike imports. For the latest completed financial year 2022/23, the value was just 1.13 times greater. In other words, the two categories are quickly trending towards parity in total FOB value. (FOB means free on board, which is the price importers pay to the manufacturers before any freight and taxes are added.)
Because there are higher wholesale and retail margins on conventional bikes compared to e-bikes, we still have a way to go until e-bike sales match conventional bike sales in terms of total retail sales dollars and then later retail sales margins.
But a key point is that e-bikes have caused the total market to grow significantly.
Look at the 2017/18 totals when conventional bike imports were $322,410,474 and e-bike imports were $39,414,341. In total the bicycle import value was $361,824,815.
Now compare that to 2022/23 – our first post-covid financial year when units of conventional bikes imported were down dramatically, but units of e-bikes imported were only down slightly compared to the 2021/22 peak covid boom year. The value of conventional bike imports was $356,964,655 and the value of e-bike imports was $315,301,656. That’s a total of $672,266,311.
Please keep in mind that import data covers product that is sold via all categories including mass merchants such as K-Mart, ‘big box’ such as Anaconda, online mail order, plus independent bicycle dealers.
Even in the year that some industry members might describe as a ‘post covid slump year’, total bike imports (e-bikes plus conventional bikes) are up by over $310 million or 85% on what they were when e-bikes were just a blip on the radar.
That’s not adjusted for inflation, but our industry has grown significantly over the past six years, even when the end point in our comparison is the first full post-covid year. And I predict that the growth trajectory, particularly for e-bikes, still has some years to run. So despite the recent overstocks and discounts, I’m still bullish about the medium to long term prospects for the Australian bicycle industry.
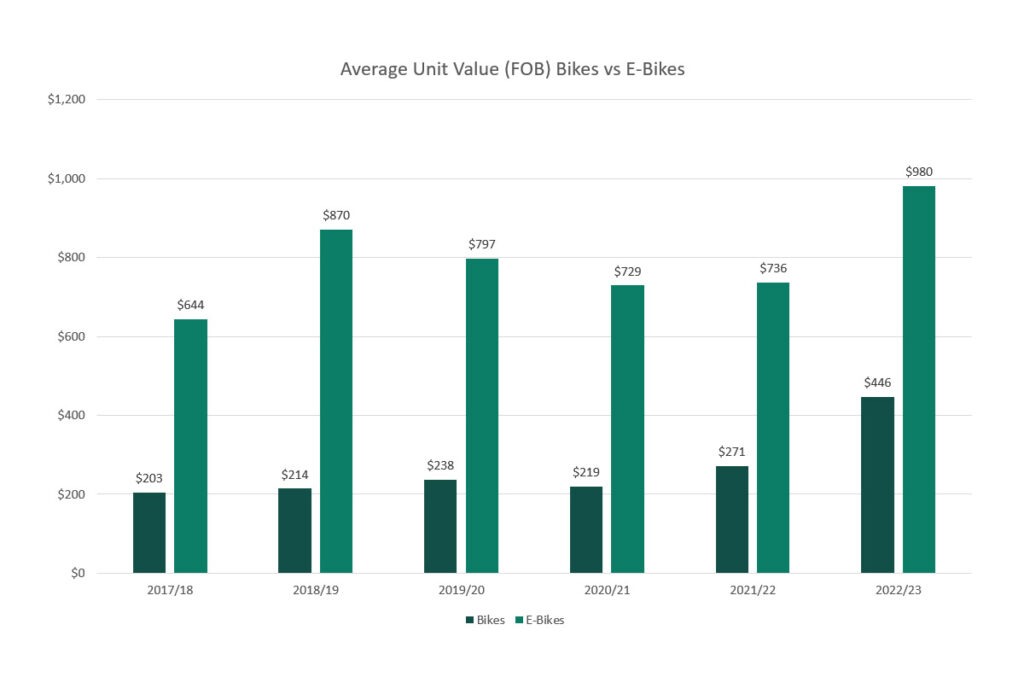
One key factor driving up total import values is that unit values of both conventional bikes and e-bikes have risen sharply over the most recent year.
Conventional Bike Imports
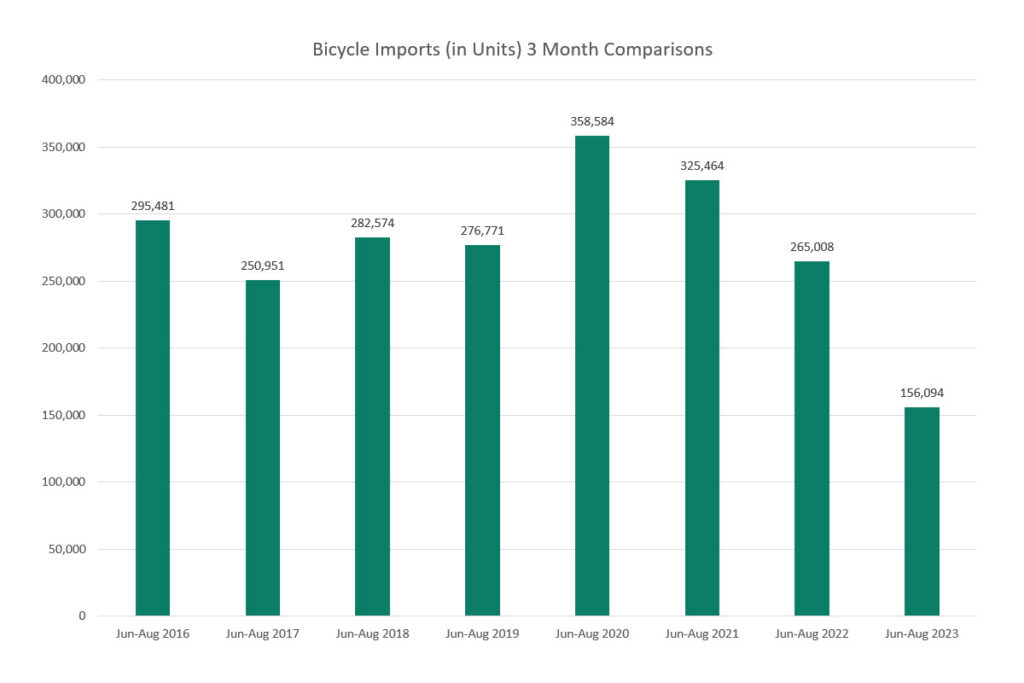
Looking specifically at the import data for non-electric bikes, during the months of June, July and August 2023 a total of 156,094 bikes were imported into Australia.
If you look at the chart labelled “Bicycle Imports (in Units)” you can see just how low that number is. It’s less than half the number imported during the corresponding three months of the two covid boom years and over 100,000 units below the typical pattern in non-covid years.
We have now seen 12 consecutive months of data since September 2022 in which monthly import numbers dropped dramatically.
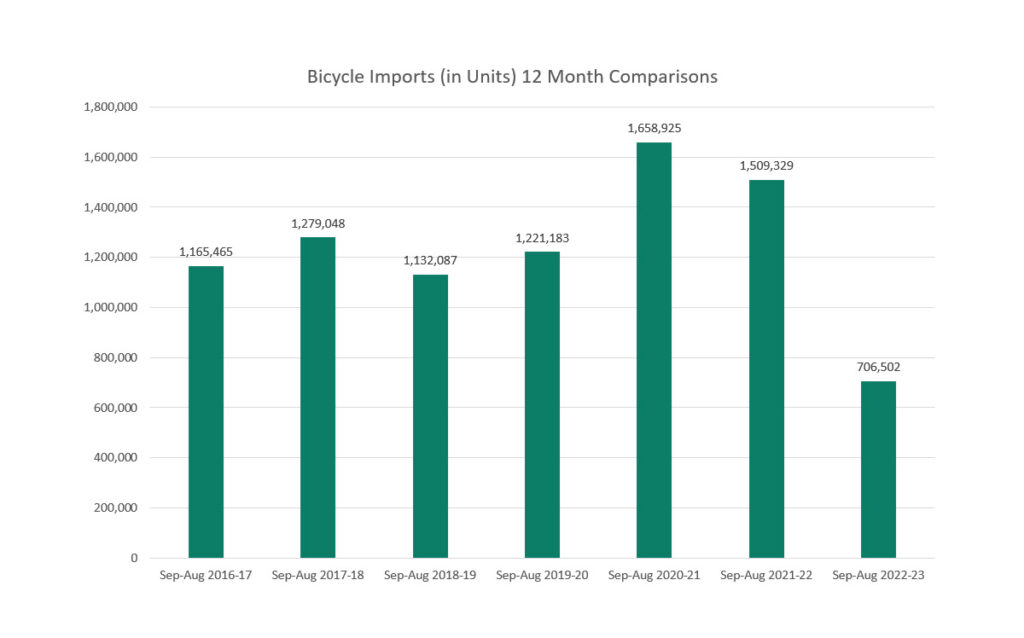
During those 12 months just 706,502 bicycles have been imported into Australia. Please refer to the second chart “Bicycle Imports (in Units) 12 Month Comparison” to see just how great a fall that has been.
As you can see, imports for the most recent 12 months of data are less than half the levels of the two covid years. Possibly more significantly, imports prior to covid fluctuated in a relatively narrow range of about 1.2 million units per year. So the latest 12 months have been half a million units below the pre-covid ‘baseline’.
Import data for conventional bikes is broken down into kids bikes and adult bikes, unlike e-bike import data which is reported as a single category.
For conventional bikes the latest three months of data showed 22,651 kids bikes imported in June 2023, 20,721 in July and 30,763 in August for a three month total of 74,135. That’s down by only 6.5% compared to the corresponding three months of 2022 when the total was 79,282.
Meanwhile, the latest numbers for adult bikes were 24,935 in June 2023, 24,450 in July and 32,574 in August. That makes a three month total of 81,959 units, compared to 185,726 for the same period in 2022, a drop of 55.9%.
In summary, imports of both categories were down, with adult bikes down by far more than kids bikes, but even kids bike imports are still well down on pre-covid ‘baseline’ levels.
E-Bike Imports
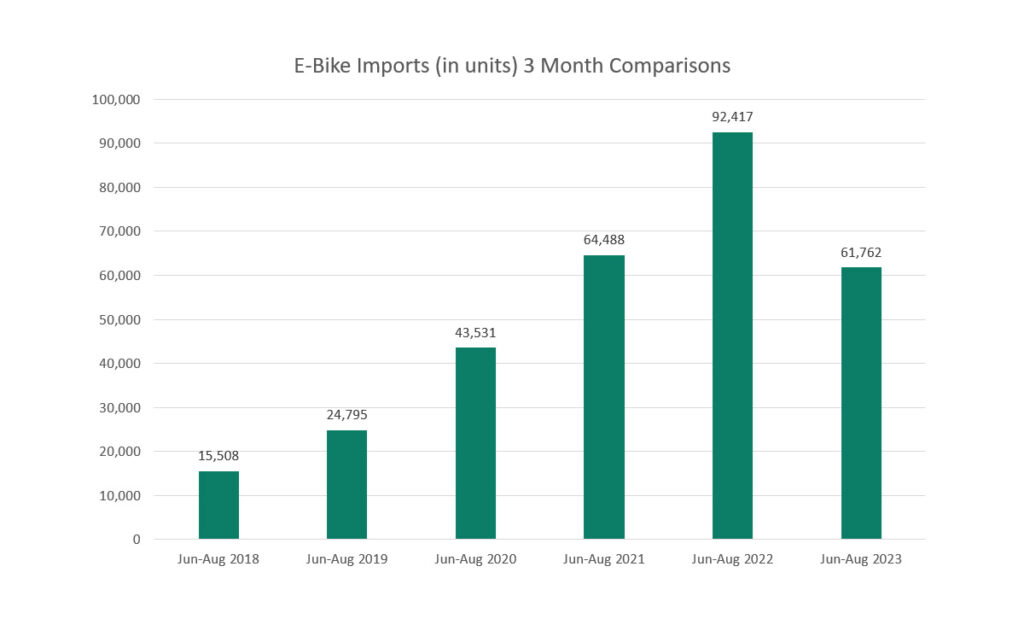
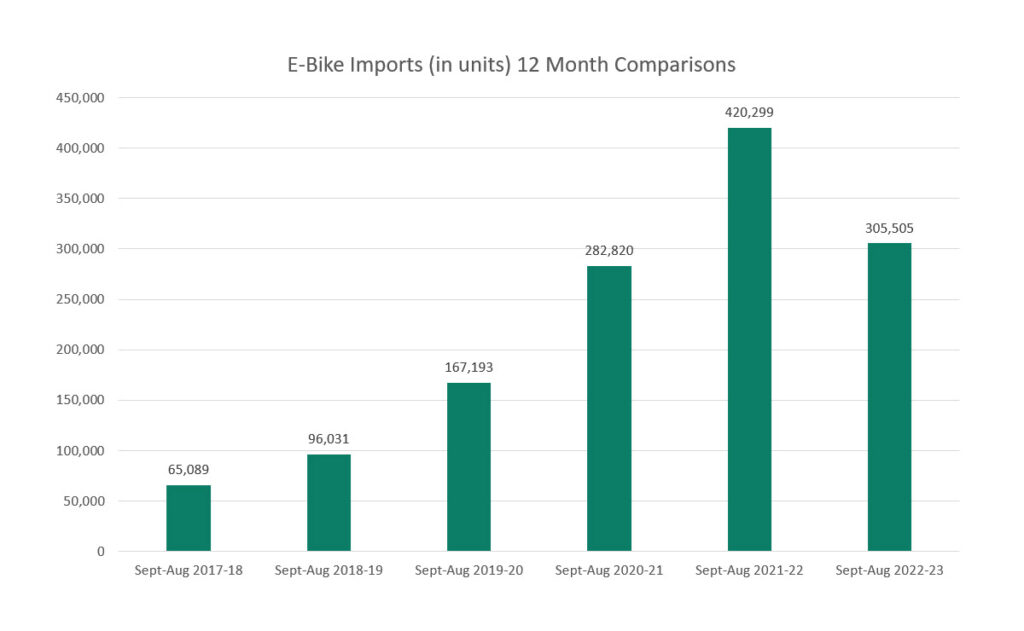
For the most recent three months of data reported, June-August 2023 a total of 61,762 e-bikes were imported. That number is also down on the covid years, but, as you can see, the year comparison charts for both 3 and 12 month periods tell a different story to the conventional bike charts, with smaller drops in both cases.
Thanks to Bicycle Industries Australia who collate and share the Australian Border Force import data.