Our First Look at Six Years of E-Bike Import Data
Canberra ACT
As I confessed in another article here, I’ve only recently become aware that e-bikes imports are recorded separately under Australian Border Force tariff code number 8711.60.00, that has the following definition: “Motorcycles (including mopeds), bicycles and other cycles fitted with electric motor for propulsion, with or without sidecars.”
The problem that’s immediately apparent upon reading this code is that includes electric motorcycles and electric mopeds (that typically look like Vespa-style electric motor scooters), as well as all types of e-bikes. We’re planning to do further investigation to find out how many of these other two vehicle types are imported under this code.
But it appears there is no specific industry body for the motorcycle or motor scooter sectors and that they are represented by the FCAI (Federal Chamber of Automotive Industries). Apparently the FCAI is mainly concerned with cars and other larger motor vehicles, as a much bigger market, and does not collect specific data on electric motorcycles and mopeds.
Anecdotally, electric motorcycles have not taken off to anywhere near the extent of e-bikes. For example, according to media reports, the much-publicised Harley Davidson Livewire has attracted low sales both within Australia and globally.
There are some electric dirt bikes and small crossovers, such as the Stealth and Sur-Ron brands. There are also electric moped (motor scooter) brands such as Fonz, Benzina Zero and others.
But for now I’m going to take a guess that of all the vehicles imported under this tariff code, only around 20% are either e-motorcycles or e-mopeds and approximately 80% are e-bikes.
Based upon this assumption, here are three charts showing the total volume, total value and unit value of e-bike imports over the past six years.
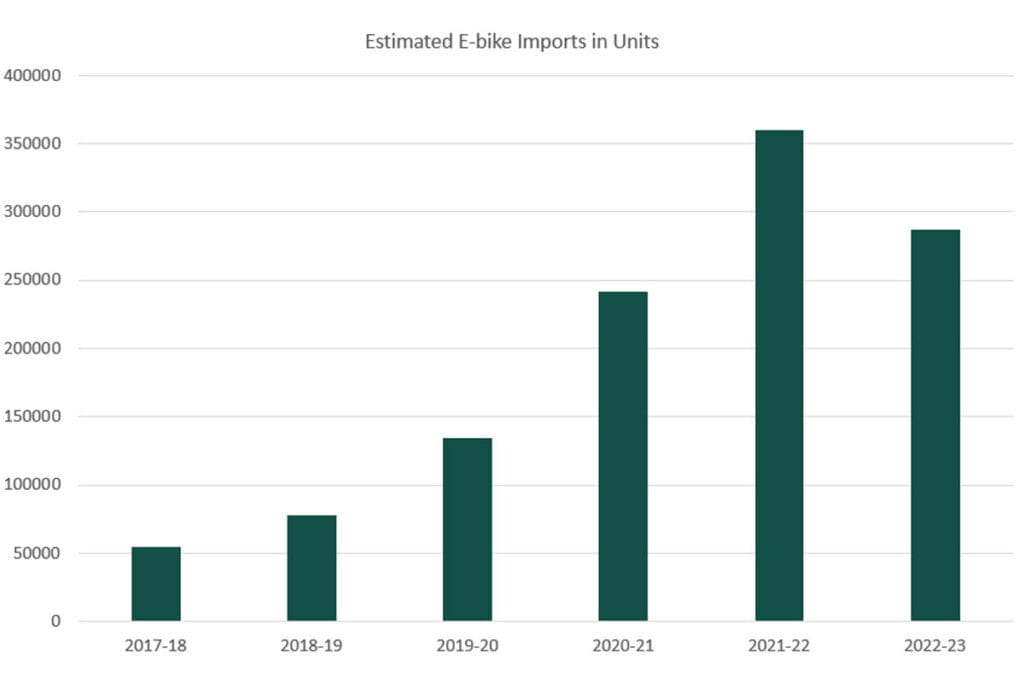
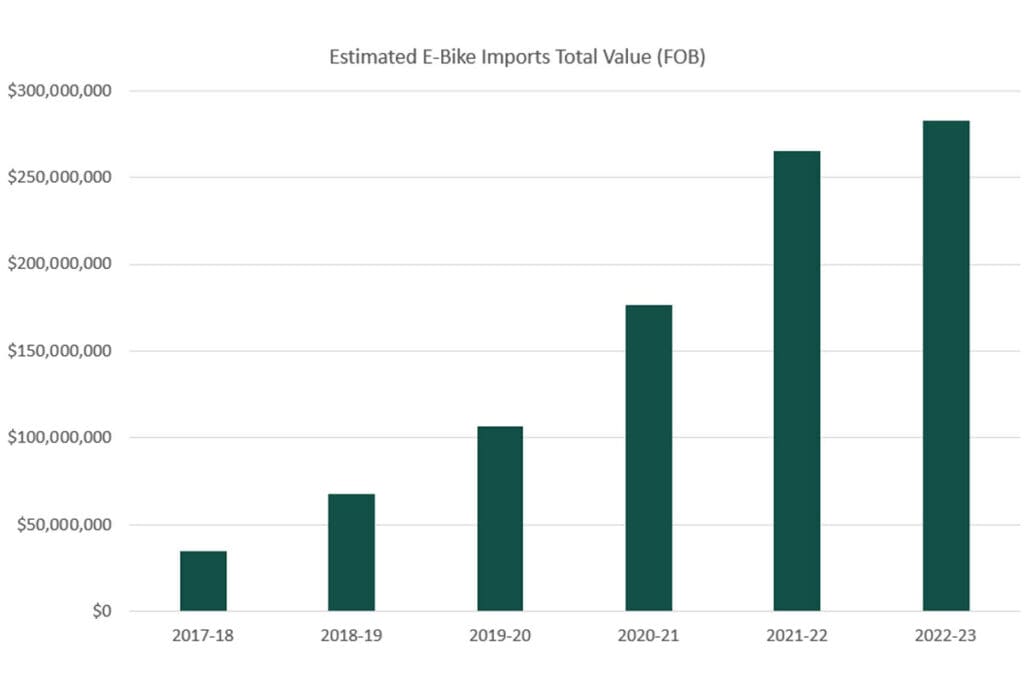
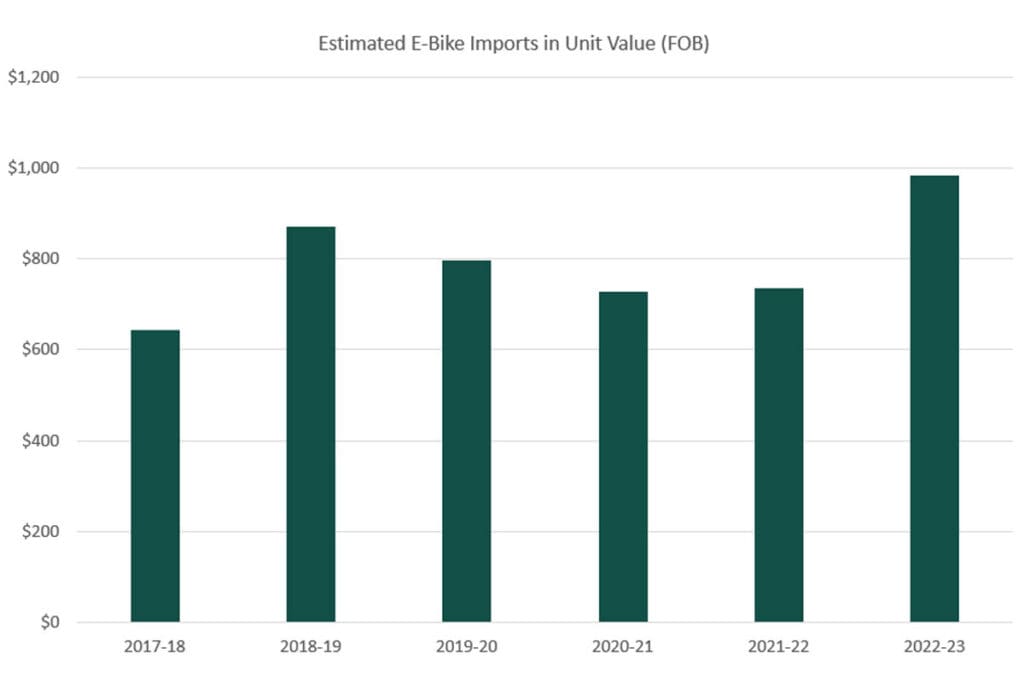
One caveat with the charts above is that we only have data up to May 2023, so for the month of June 2023 I’ve included projections for both the number of units and average unit value, based upon the trend of the previous months.
These charts are showing that e-bike imports have grown rapidly from 54,378 units in 2017-18 to a peak of 359,858 units in in 2021-22. That represents a Compound Annual Growth Rate (CAGR) of 45.9%. In other words, over this five-year span, the number of e-bikes imported into Australia was growing on average by 45.9% each year over the previous year. That’s a very rapid rate of growth for any market.
But another important piece these charts do not tell us is how many of these e-bikes are being sold via independent bicycle dealers (IBDs) and how many via other channels. These other channels would include mass merchants, big box retailers, direct importers (including many food delivery rider e-bikes), mail order and non-traditional retailers such as surf shops. As is the case with regular bikes, or ‘acoustic’ bikes as they’re sometimes called, these non-IBD channels would account for a large proportion of total sales by units, mainly at the lower-end price points.
Just like regular bikes, because there’s no significant volume of manufacture within Australia, it’s fair to assume that the number of imports will eventually result in a virtually equal number of sales. Let’s take a guess that IBD e-bike sales represent 60% by volume and 70% by value of total e-bike sales.
That would mean that for the most recent fully reported financial year, 2021/22, total e-bike sales via IBDs were 215,915 units at an FOB (Free on Board ie. import value) of $185 million before taxes and mark-ups. Both wholesale and retail mark-ups are lower on e-bikes than regular bikes, so if we multiply the above figure by 1.6, that will give a retail value of $296 million for e-bikes sold through IBDs in 2021/22.
To put that number into perspective, it relies upon guessing the proportion of vehicles under the tariff code that are e-bikes, then guessing the proportion of e-bikes that are sold via IBDs, then guessing the total taxes and mark-ups to take the FOB up to the retail value.
In other words, it’s three layers of compounded guesswork, so I suggest that ‘plus or minus $100 million’ would be a fair margin of error. That would make the total annual retail value of e-bikes sold via IBDs in Australia equal to anywhere from about $200 to $400 million.
Clearly that’s a very wide-ranging estimate, but any number within that range is a serious addition to the annual sales of our Australian IBD network compared to the years preceding e-bikes.
There’s one final guess to make, which is to answer the question: “How many of these new e-bike sales come at the expense of traditional bike sales and how many are new sales that would not have otherwise occurred?”
My gut feel on this question is that most are new or additional sales, quite often to customers who already own one or more regular bikes, but choose to add an e-bike to their collection. But there would also be some customers who are buying an e-bike instead of a regular bike, so in addition to corrections for overstocks, the rise of electric bikes might be part of the reason regular bike imports have been down so far in 2023.
We’ll do more research into the data around e-bike sales over the coming months. But in the meantime, if you have opinions or comments about any of the data above, please share them below.
Thanks to Bicycle Industries Australia (BIA) that compiles the monthly import statistics from data supplied by Australian Border Force.
Join the Conversation
What is your opinion in relation to the estimates in this article? How many e-bikes do you think are being sold, and at what value? How many do you think are ‘new sales’ and how many are at the expense of traditional bike sales?